Release highlights 2016T3
Diagram
Color coding - new tool to check consistency of the diagrams
In complex diagrams, it is not always easy to remember what pipeline was assigned what nominal size. Therefore in 2016T3 we introduce the new possibility to change the color scheme and see each different nominal size as a different color. This color scheme helps users to prevent errors in object’s nominal sizes. Using the functionality improves the quality of the diagram and helps to keep integration data coherent.
When using the color scheme, it’s easy to notice the difference in nominal sizes and spot any errors. With one click the user can restore the normal colors of all objects according to their systems. Objects with no nominal size data are dimmed to grey when a black background is used. The user can continue working with NS colors on. When the diagram is opened, the default color is always By System.
Comparison with the 3D model.
Comparison with the 3D model ensures there are no differences between diagrams and 3D model. Changes might be done in either, but comparison ensures that the two are synchronized. The tool Compare Diagram with 3D Model helps diagram users to get feedback from a 3D model. In case the 3D designer has made correct changes they can be updated to Diagram also. This can be for example information about the selected component model or some integration attribute data that is sent back to Diagram. This tool helps users to examine changes, have correct integration data through different project phases and prevents mistakes.
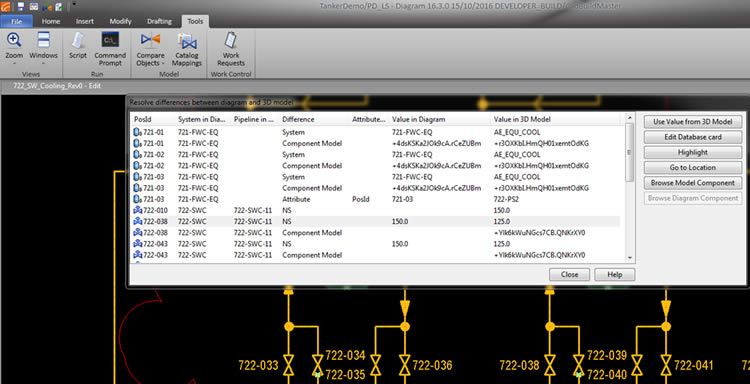
Compare Objects with 3D Model command opens list window that shows items with integration link to 3D model that have differences in data between 3D model and Diagram.
Differences that are shown are:
- Integration attributes with modification rights both in 3D Model and in Diagram
- Difference in selected component model
- Difference in system for equipment
- Difference in system and pipeline for valves
- Nominal sizes of valves for first two nominal sizes
- Name of cable
- Material of cable
- System of cable
- Interference class of cable
- Maximum length of cable
Each difference is shown on a separate row. Differences can be sorted by columns. Multi -selecting of list items is possible. Use Value from 3D Model replaces the value in the diagram with the value from a 3D model. Multiple differences can be resolved by multi-selecting. Edit Database card opens database to give an alternative value. Highlight gives highlight color to the object in the active Diagram. Go to Location works only for single selected object and moves the cursor on top of the object. Browse Model Component and Browse Diagram Component show the component was selected from the library in 3D model and Diagram.
If Diagram user knows that the value is correct in Diagram, the difference will stay on the list until the respective tool is used in Plant Modeller and the difference has been resolved there. Remaining rows can be selected and copied with Ctrl+C -> Ctrl+V and reported forward.
To make sure that users don’t forget to perform comparison, project administrators have the possibility to define that the comparison tool is to be run whenever Check-In, Check-Out or Publish to 3D are used.
New mapping between 3D and Diagram nodes.
More precise assistance to the 3D designer is now possible at node level. Version 2016T3 enables manual node mapping between diagram and 3D model. When mapping is done and 3D designer selects a node to start the routing of a pipeline, the correct pipeline is automatically selected. If the pipeline is heading to a mapped valve or equipment node, the routing assistance bar will show the way to the correct node. The feature gives better tools to P&I Diagram user to ensure that each pipeline will be correctly connected in the 3D model. In Plant Modeller mapping of nodes significantly reduces the need for selections of pipelines and their target connections and greatly improves the quality of piping design. Automatic mapping will be coming in the future releases.
The mapping tool reads the node information from the component geometry (GDL) and presents it together with node information from the Diagram object. Default mapping of nodes is made if names of nodes are exactly same in the component’s GDL and Diagram.
Node-to-node mapping
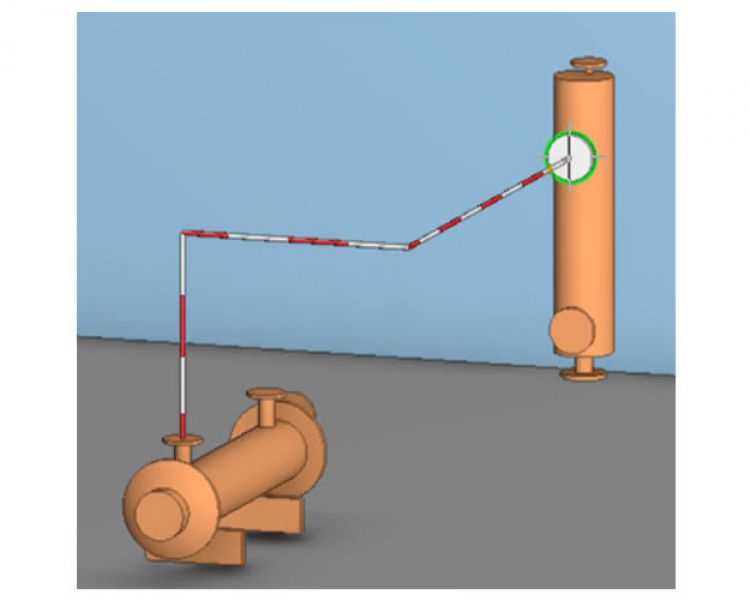
Node-to-node mapping
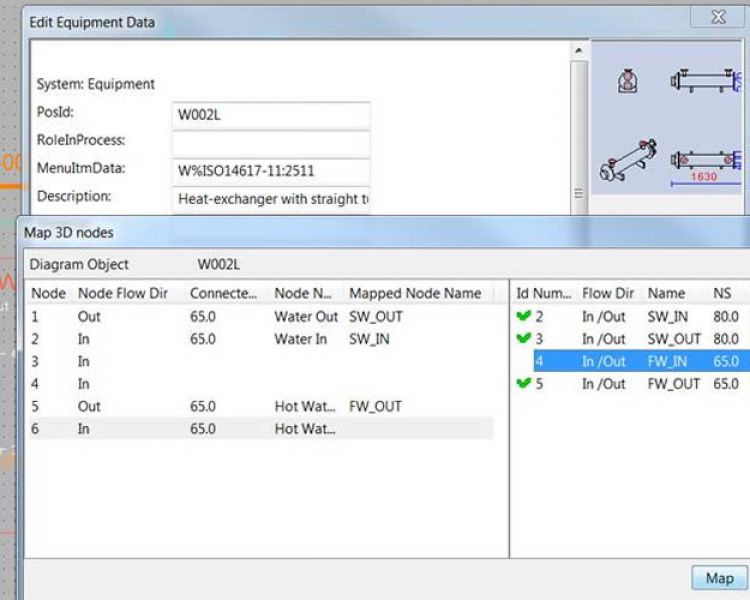
Diagram mapping
Outfitting & Plant Design
Protection of Intellectual Property in Design projects implemented via Filtered Replication
In versions up to 2016Q2, replication was based on a complete project model, and that often caused the need for additional non-disclosure agreements to be made with subcontractors or project partners to protect intellectual property and know-how. Starting from the version 2016T3, CADMATIC supports filtered replication to protect intellectual property in design projects. If a company prefers a subcontractor to only have access to their parts of the project, it is now possible. Project replication setup could include a filter for 3D objects via 3D box based selection. The remote design team will get only the part of the 3D model they need for their tasks.
With filtered replication, the subcontractor has access only to designated areas of the project, and can’t for example publish an eBrowser model of the whole project. When drawings are made it is now possible to use drawing mask boxes to restrict visibility in drawing views. Objects that are completely inside a mask box are not shown in drawing views. Objects that are partially inside a mask box are clipped in visualization and the part of the object that is inside the box is not shown.
Filtered replication
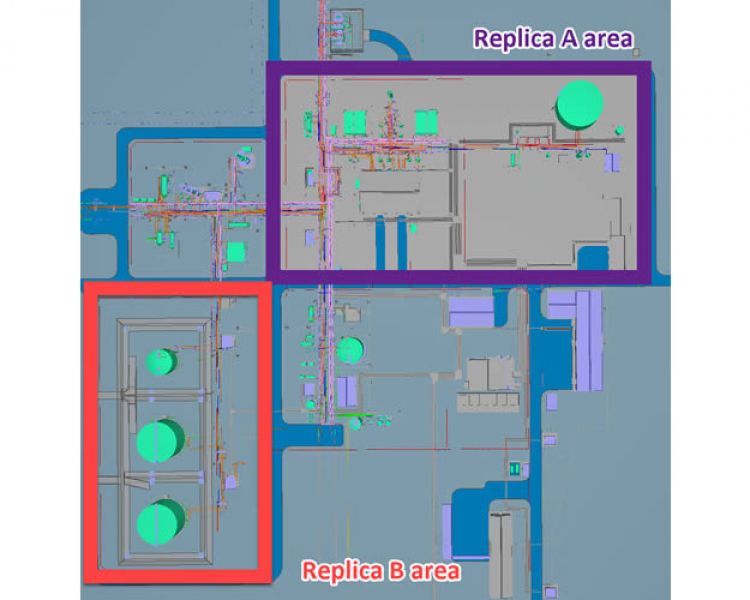
Filtered replication
New 3D visualization core in Plant Modeller
As the first step of an important project of taking the user experience to the highest level, a new visualization core was implemented in Plant Modeller. The first presentation of the new visualization core was done during the CADMATIC Users’ Meeting 2016 in May in Prague and received a warm welcome from all users.
Here are some of the features of the new visualization core:
- Significantly faster performance, especially with big 3D models
- Better visualization for both design and presentation purposes
- Clearer object visualization to make work with the 3D model easier: see edges, shades, and surface patterns
- Better looking visualization to present the design to the customer, several backgrounds are included (ocean and the sky, grass field and desert, and several other scenes)
- Enhancements to the user interface: improved pick object functionality, showing properties of object under the cursor
- and more to come!
Using modern technologies, CADMATIC can now fully benefit from hardware graphic processors and make everyday design work more visual. A realistic presentation of 3D objects, accurate presentation of edges, shades and clip caps surfaces enables easier design work. For presentation purposes, it is possible to take one of the predefined background images which include 3D lighting style, and make a visually attractive image of the project on the fly, without a need for complex rendering in third party software.
Courtesy of Wärtsilä AS Norway
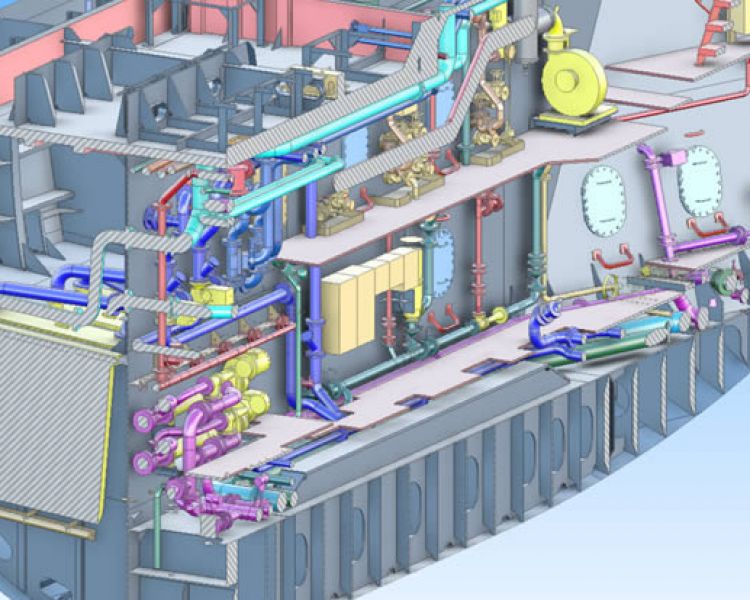
Courtesy of Wärtsilä AS Norway
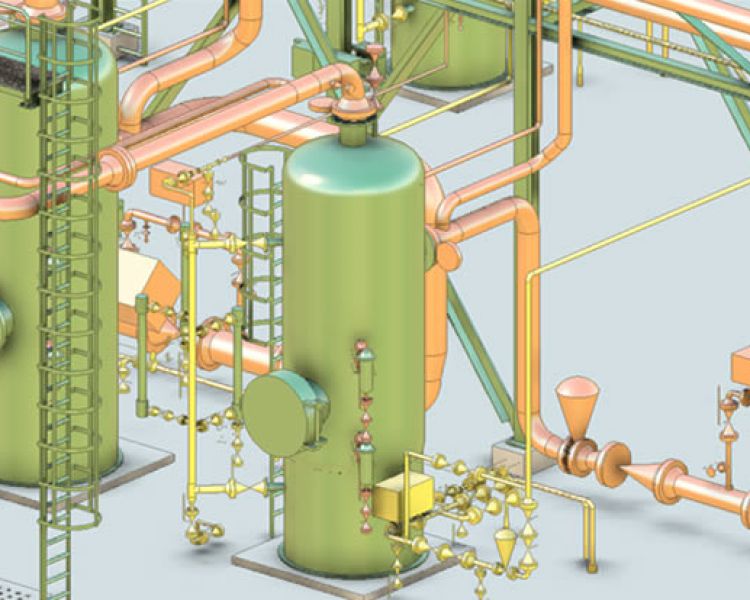
2016T3 Visualization
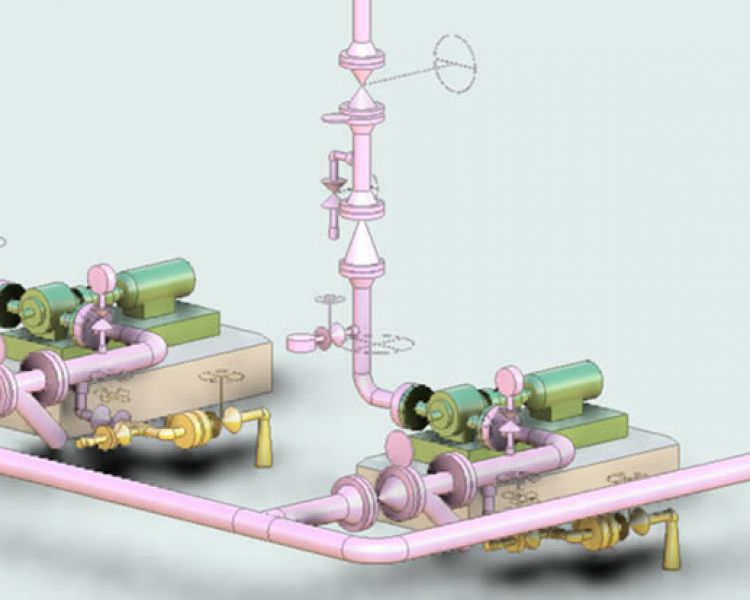
2016T3 Visualization
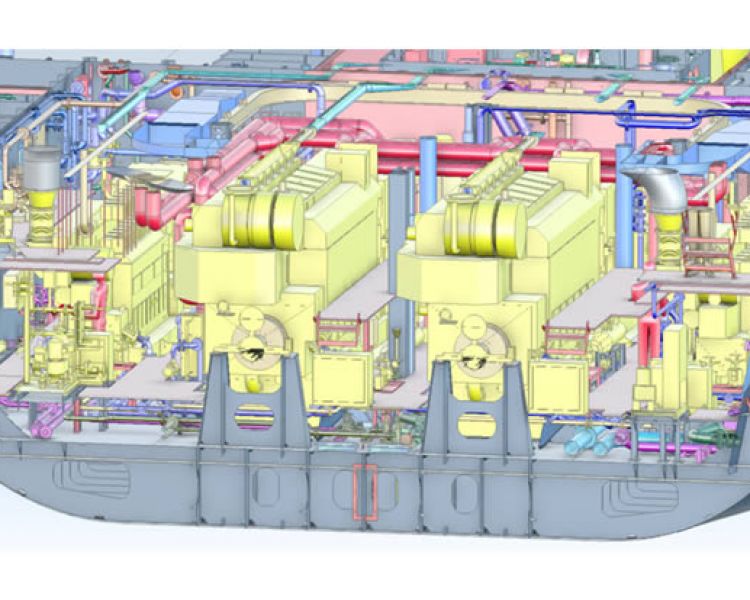
Courtesy of Wärtsilä AS Norway
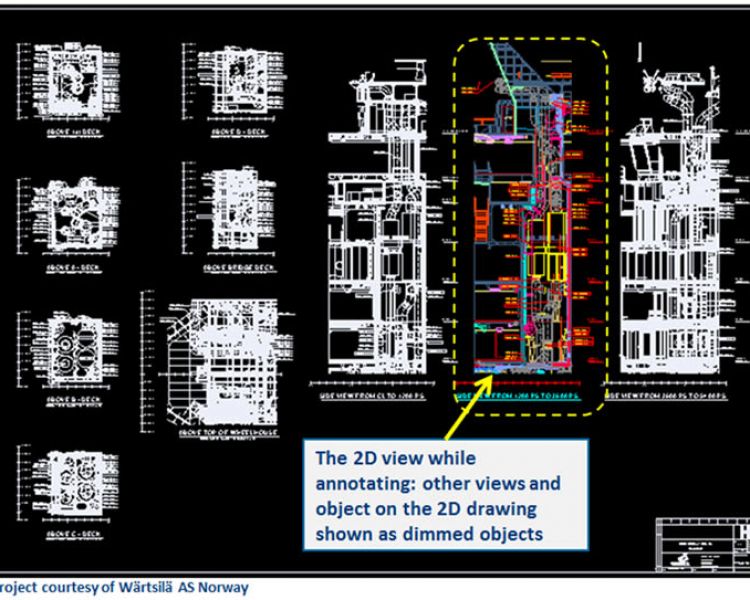
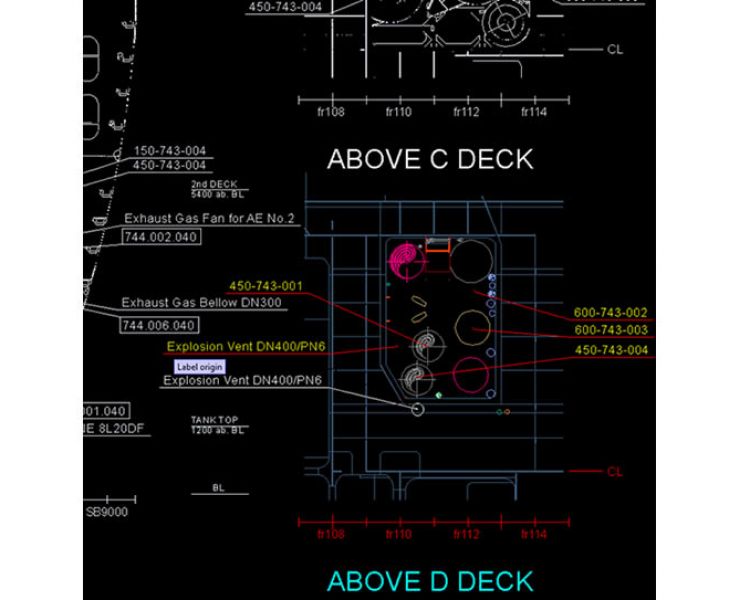
Automatic labeling in drawings
Despite the high level of digitalization in industrial design, companies still need to produce sets of project documentation and drawings. Improved robustness of creating complete drawings is an important part of the 2016T3 release. We offer users a new way to generate automatic labeling in 2D documentation.
A sophisticated mechanism finds a possible location for each label and optimizes labels positions so that labels and their reference lines overlap or intersect as little as possible with graphics from 3D and other 2D annotations. This way the user is one step ahead in finalizing the views. Generating labeling by easy selection of labels and desired style of annotation uses remarkably less time in the drawing phase and improves the end result in many cases via having less forgotten labels.
Further additions include the possibility to see the whole page while annotating only one view. This is especially useful when space for labels and other texts is limited and overlapping with other views.
2016T3 Labeling
2016T3 Labeling
2016T3 Labeling
Cable Tray Segregation rules
In the Cable Router, there is a new possibility to group cables according to the segregation rules. These rules take into account, besides the free rectangular space, also the packing method, e.g. the maximum number of cable layers and the shape of the segregation group cross section. In the leftmost segregation group above, you can see a triangular cross section style, with a maximum of three layers of cables.
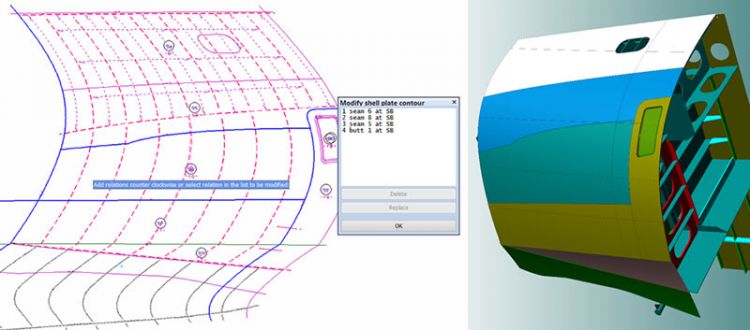
Hull - Development of the Shell Plates
In version 2016T3 of CADMATIC Hull, we are proud to present a completely new Shell Plate module. We had two main targets in mind: ensure the highest accuracy of shell plate development in production and develop user-friendly tools to create and modify the shell plates in the 3D model. We combined three main drivers to ensure top quality design: the optimal positioning of shell frames, precise definition of hull surfaces, and fast torsion-less hull line positioning. Shell Plates is the module dedicated specifically to all tasks related to shell plate development in different stages of the project life cycle: basic design and hull lines, engineering and shell plate modeling and production tasks. It starts with the definition of hull lines, optimization the shape and position of shell frames. The user can easily define and modify shell plates as needed based on the surface model. In the end, templates are created to facilitate production.
The tool for shell plate development simplifies the engineering task, so the creation of curved plates is as easy as a flat plate,” Mr. Paul Filius, Technical Director at CADMATIC.
The Hull database can import all kinds of surfaces. The intersection server ensures that all shape-related construction materials have the correct shapes. Topologic hull lines can also be developed The user has great flexibility creating multiple hull lines, which helps to divide the shell panel easily. Shell frames can be created without torsion of hull lines by inheriting the “In-plane” property. This makes the production of these profiles much easier at a later stage. These fundamental components, the Hull database, and topologic hull lines, give the user the possibility to develop several types of shell views with all the necessary and correct information and to develop the shell plates along 3D surfaces.
The new functionality is so easy to use that an engineer can create the most complicated shell plates in an instant. The shell plates are part of the block structure. The shell plates and bulkheads are visible in all views so the bulkheads and decks can be easily related to these shell plates. The bevel rules ensure that each part is connected with the correct bevel type. The so-called natural bevel, exceptions can be modified later.
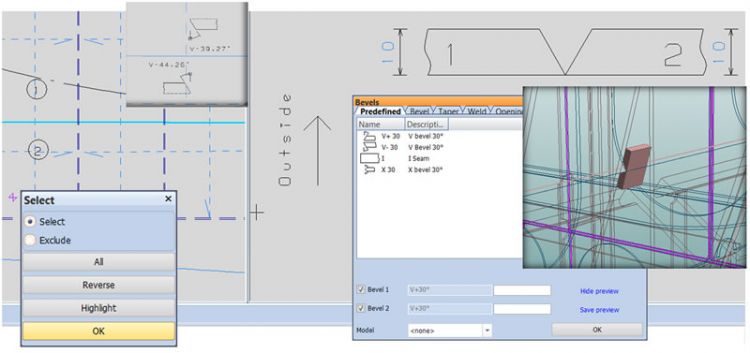
The precise intersection, which uses the bevel shape, ensures that the plate cutting data (DXF) of the part gets the correct outer contour. Holes can be created by selecting a closed Hull line. Due to the topologic hierarchy, every change affects the related construction and keeps the model consistent.
The Template Wizard helps the production engineer to create templates in an interactive way and to get shell plates ready for production. The system helps the production engineer with default plane positions, which mostly fit the yard standard, while modification and repositioning are easily done. The production information of the templates and shell plates contain all the information for production to bend the shell plate to fit the real shape.
More possibilities for cutouts and lugs
In version 2016T3 we extended the number of variations in cutout types and lug shapes. With these alternatives the user has more shape variations with fewer cutouts. Now it is possible to adapt the cutout shape better to the weld lines and speed up the assembly process.
Hull
Hull - Development of the Shell Plates
In version 2016T3 of CADMATIC Hull, we are proud to present a completely new Shell Plate module. We had two main targets in mind: ensure the highest accuracy of shell plate development in production and develop user-friendly tools to create and modify the shell plates in the 3D model. We combined three main drivers to ensure top quality design: the optimal positioning of shell frames, precise definition of hull surfaces, and fast torsion-less hull line positioning. Shell Plates is the module dedicated specifically to all tasks related to shell plate development in different stages of the project life cycle: basic design and hull lines, engineering and shell plate modeling and production tasks. It starts with the definition of hull lines, optimization the shape and position of shell frames. The user can easily define and modify shell plates as needed based on the surface model. In the end, templates are created to facilitate production.
The tool for shell plate development simplifies the engineering task, so the creation of curved plates is as easy as a flat plate,” Mr. Paul Filius, Technical Director at CADMATIC.
The Hull database can import all kinds of surfaces. The intersection server ensures that all shape-related construction materials have the correct shapes. Topologic hull lines can also be developed The user has great flexibility creating multiple hull lines, which helps to divide the shell panel easily. Shell frames can be created without torsion of hull lines by inheriting the “In-plane” property. This makes the production of these profiles much easier at a later stage. These fundamental components, the Hull database, and topologic hull lines, give the user the possibility to develop several types of shell views with all the necessary and correct information and to develop the shell plates along 3D surfaces.
The new functionality is so easy to use that an engineer can create the most complicated shell plates in an instant. The shell plates are part of the block structure. The shell plates and bulkheads are visible in all views so the bulkheads and decks can be easily related to these shell plates. The bevel rules ensure that each part is connected with the correct bevel type. The so-called natural bevel, exceptions can be modified later.
The precise intersection, which uses the bevel shape, ensures that the plate cutting data (DXF) of the part gets the correct outer contour. Holes can be created by selecting a closed Hull line. Due to the topologic hierarchy, every change affects the related construction and keeps the model consistent.
The Template Wizard helps the production engineer to create templates in an interactive way and to get shell plates ready for production. The system helps the production engineer with default plane positions, which mostly fit the yard standard, while modification and repositioning are easily done. The production information of the templates and shell plates contain all the information for production to bend the shell plate to fit the real shape.
More possibilities for cutouts and lugs
In version 2016T3 we extended the number of variations in cutout types and lug shapes. With these alternatives the user has more shape variations with fewer cutouts. Now it is possible to adapt the cutout shape better to the weld lines and speed up the assembly process.
Information Management
eBrowser – check collision reports from Plant Modeller
eBrowser now allows loading a collision report, exported from Plant Modeller, and the user can easily check for the collisions. This way even people with no access to the design applications can participate in checking the collisions. You can easily browse through the collisions by status, examine the collisions, and use all other features offered by the model tree. It is possible to add markups to clash locations and share ideas on how to handle these.
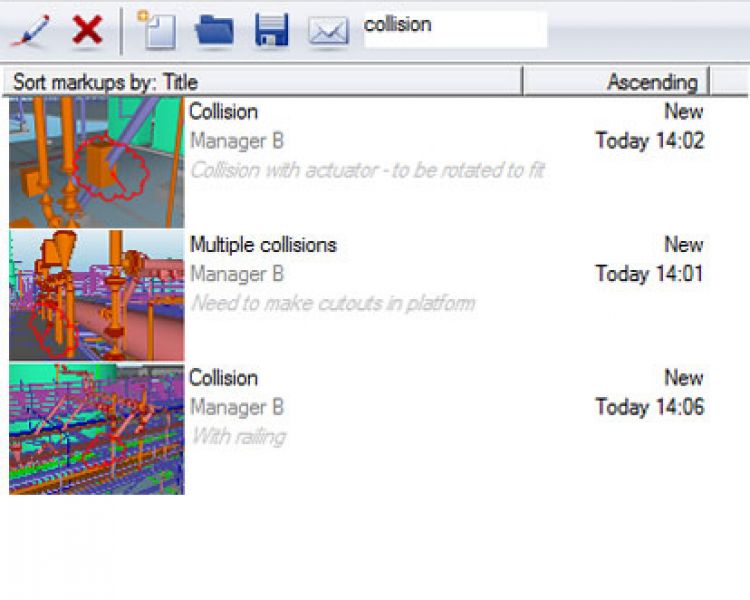
eBrowser – Find markups faster
Users who use massive amounts of markups are now able to find the markup they are looking for faster than ever, by using the filtering feature included in the markup list. Filtered markup list only shows markups that contain the search string in one of these fields: Title, Creator, Comment author, Comments.
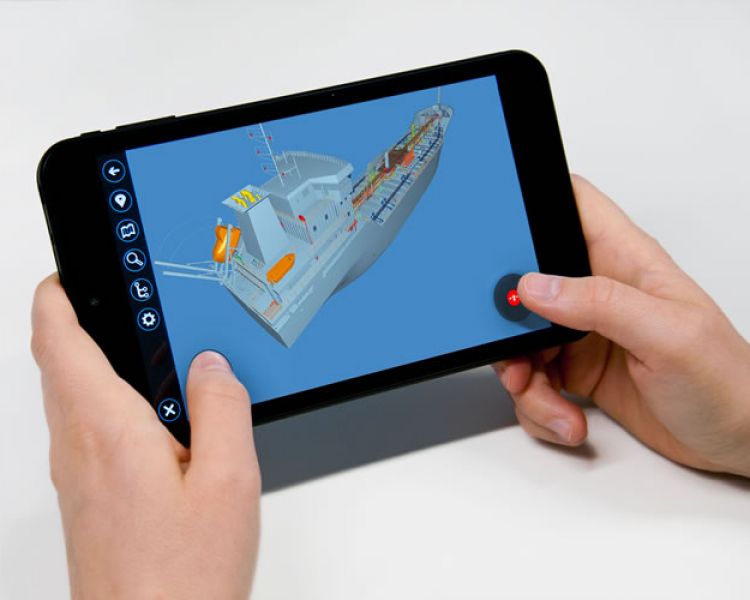
eGo – Fly through the model using virtual joysticks
The first versions of eGo provided a touch interface for moving inside the model that uses the widely known touch gestures: pinch for zooming, two fingers for panning and so on. This method has proven to be handy for example when examining large open facilities where you can quickly zoom into a unit, but it does not give the possibility to truly fly inside the model, which for many people is a more natural way of moving inside a ship or plant, and is the experience that is familiar from our eBrowser desktop review tool. The standard touch interface for flying typically available in 3D games and drone controller applications based on on-screen virtual joysticks that provide separate controls for moving, turning and zooming. We have now fulfilled the request of many users with virtual joysticks in eGo. They can be used side by side with the existing gesture interface, which gives users the flexibility to choose whichever way suits the situation and the user’s preferences the most.
eGo
eGo
eShare – Workflows make changing statuses a breeze
You can assign a status value to any object in the 3D model in eShare or eGo (and further synchronize it with eShare) to track installation progress, maintenance needs, or any other status of objects. eShare now has a convenient mechanism for managing transitions from one status to another. You can define a workflow for the status changes of an item, and even though following the workflow is not mandatory, it makes it easier for the user to select an expected status and minimizes the risk of incorrect status changes. Status workflows can be used in both eShare and eGo.
eShare – Numerous smaller improvements
- Several categorizations can be defined based on the same attribute
- Categories can be combined in all categorizations
- Items can be searched based on status
- Project name can be used in URI API
- Links in 3D model open correct page from managed documents
- Link highlighting is now configurable
- Printouts now contain QR code, coordinates, and Smart Points
- Improved speed both in document list and when viewing large documents