Drawingless production in digital and data-driven shipbuilding

If the answer to this question is that straightforward and such an obvious direction for the development, one can only wonder why this change has not happened already. 3D models have been around in shipbuilding for almost 50 years. Has this not been enough time to polish the technology and replace old artifacts, such as 2D drawings?
This article shows that the answer is not that simple and does not depend exclusively on technological aspects.
The power of creative destruction and Kondratieff’s waves theory
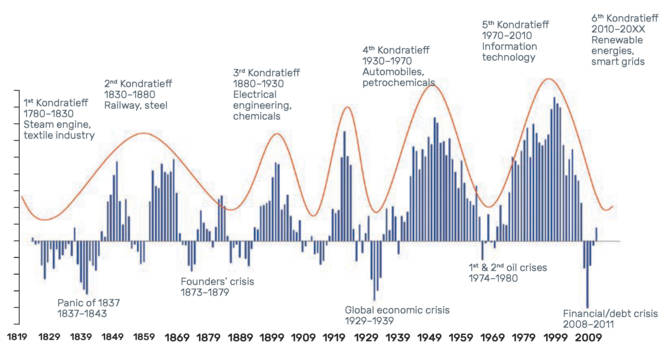
Kondratieff’s waves theory provides a broad structured view of the history of technological development. Based on the financial data from rolling 10-year returns of Standard & Poor’s top 500 companies, spikes or waves can be observed that match technological changes. Figure 1 presents these waves along a timeline. Behind every significant upswing in financial returns, which moved societal development forward, there is a considerable step in the use of new technology: steam engines, railways, electricity, automobiles and petrochemicals, and information technology. None of the technologies is an isolated innovation or achievement: it is something that society was able to adapt and use profitably. Technological breakthroughs are tightly linked to societal development in terms of adaptation and acceptance.
According to Kondratieff’s theory, the next and sixth wave of creative disruption will be fueled by intelligent technologies. There are many ongoing discussions in industry about digitalization, shipbuilding digital transformation and digital manufacturing, industry 4.0 and smart factories, as well as AI and the use of digital twins in production.
Intelligence is a key aspect of the sixth wave and differentiates it from its predecessor, which was based on information technology. One can speculate whether intelligence means actual AI or the possibility to be not only digital, but also data-driven.
One practical example of this change is the ongoing development of digital twins. As elaborated by Cabos and Rostok (2018), a digital twin is a digital representation of an object, enriched with behavioral models and configurations or conditions. As Hafver, Eldevik and Pedersen (2018) point out, the novelty of digital twins is not the existence and use of 3D models as assets, but how these models are bundled.
In other words, it is not about IT anymore; it is not about the possibility to digitalize all data and the 3D model, but about the intelligence behind this data.
Deep transitions theory and evolution of CAD as innovation
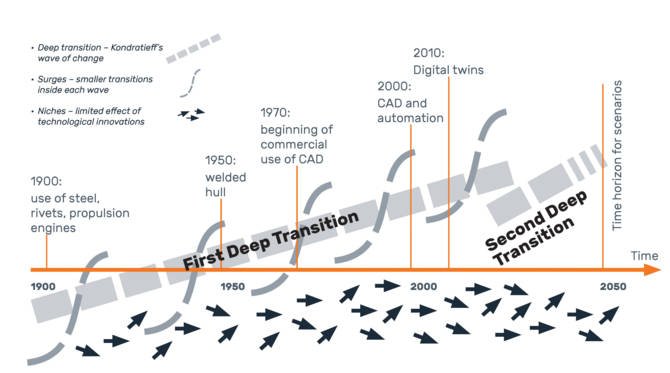
According to the theory of deep transitions developed by Schot and Kanger (2018), there are more details inside each wave as it can be split more accurately into approximately 50-year cycles. An interesting result can be observed if this theory is applied to changes in shipbuilding. Figure 2 illustrates the main technological changes and innovations concerning deep transitions.
The era of IT in shipbuilding aligns with the beginning of commercialized use of CAD systems. Triggered by IT advancements, CAD evolved in the early 1970s from an innovation into something that became a common and essential part of shipbuilding projects. It took about 50 years for the technology to mature, for the newest hardware to be taken into use and for it to be fully accepted practice. In turn, the increased accuracy of design allowed even larger and more complex projects to be handled, a development that took shipbuilding to an entirely new level. The innovation served the industry and changed it. It was, however, not an isolated phenomenon. It was made possible by societal developments that required a large number of cargo ships and other types of vessels for global trade. As such, the context of innovation plays an essential role in the transition.
Multi-level perspective – innovations in context
The Multi-Level Perspective (MLP) framework is useful in understanding how a transition occurs and what makes it possible for an innovation to become viable and widely used.The multi-level perspective approach was originally developed by Frank Geels to explain socio-technological transitions, with a focus on sustainability. It presents a transition process in the context of three main layers: landscape, regime, and niche. The landscape layer represents the most stable structure – the existing state of things; it is a mixture of the political and economic landscape, the historically and socially stable way of doing things, and time-proofed technology that has been in use for a long time. The regime layer is more dynamic and consists of existing practices and the ways of process organization. Niches are the most dynamic places for incubation of new ideas and practices. Presumably, niches appear and frequently disappear, often having little impact on the system. However, when there is pressure from the landscape, the regime level has cracks and openings, creating space for the niche to enter the regime level and reshape it. “Niche-innovations may break through more widely if external landscape developments create pressures on the regime that lead to cracks, tensions and windows of opportunity” (Geels, 2010). The tension, caused by globalization and the development of IT technologies, such as increased computing power and graphics cards, created a “window of opportunity” and allowed CAD to progress to regime and landscape levels. A side effect of the transition was that CAD providers became significant players in the maritime industry.
Next wave of intelligent technologies
The intelligence of IT allows the provision of data in digital format that is suitable for production. For example, based on the data collected by CADMATIC, when the first 3D viewer, eBrowser, was introduced on the market in 2000, the direct estimation from shipyards was that they were able to reduce the number of drawings needed for production by 30%. The 3D model became accessible not only to CAD users – typically designers in the office – but also to production staff. It also did not require any special skills or training to use. It provided a powerful push to reduce the number of drawings. However, there are still cases when the amount and types of production drawings are justified by tradition and processes at a shipyard, and less by the practical need for these drawings in production.
It is not about the IT anymore, but about the intelligence behind the data
Following this development, after introducing CADMATIC’s eShare as a central portal for all interlinked project information, a further reduction of 70% of drawings was achieved. This is only one example where increased intelligence in IT technology significantly affected the number and types of drawings involved in production but was capped by societal readiness to change the existing regime. Pioneering yards, focused on innovation and effectiveness, were more ready to make the change than yards where tradition and maintaining the status quo were stronger driving forces. The human and societal factors conflict with technological possibilities in this case.
The level of automation is a key dimension in the discussion about automated production. There are many possibilities to automate production: steel cutting and bending, welding robotics, 3D printing, and automatic adjustments for workshop flows based on data analysis. Together with developments in robotics, this has become an essential factor for ship manufacturing. The cost of machinery and implementation has been a holding element in this regard.
The future of drawingless production
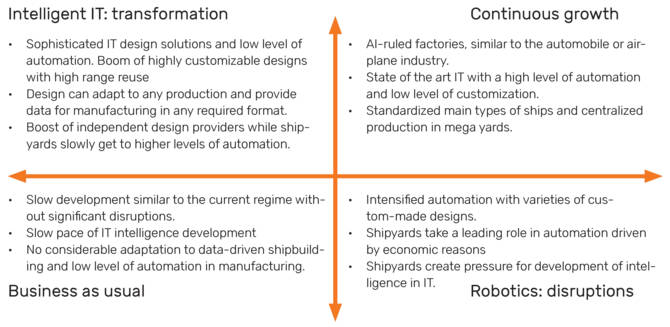
Figure 3 illustrates four main possible scenarios for the future of drawingless production. They are based on a division of high to low levels of IT intelligence and automation. Two stereotypical scenarios present “business as usual” and “high hopes for change” possibilities. The other two illustrate conflicting shipbuilding industry trends and tensions in the landscape that provide opportunities for innovations to grow.
While all four scenarios are possible, the continuous growth scenario is perhaps preferable, if one wants to be optimistic and disregard natural developmental limitations. A combination of scenarios for transformation and robotics would present a somewhat realistic picture in the medium-long perspective. In both cases, the gradual elimination of drawings in the production process is a likely outcome.
Considering the main driver of intelligent IT, drawings are already being gradually substituted with 3D viewers and with direct data transfer to production or manufacturing control systems. CAD plays a key role in the substitution process by providing interactivity with data and faster access to it within change management.
Originally, input to CAD was provided by users. This is slowly changing, however, towards the use of embedded design rules and the substitution of direct parameter inputs with inputs based on analysis or AI.
Interaction with data distinctively differentiates the digital era. The first attempts to standardize drawings aimed to improve readability and production quality. For the data-native generation, this poses unnatural limitations. Instead of a static snapshot, people prefer to obtain data on demand, and then manipulate it.
The following use case illustrates this process. Traditionally, many drawings in shipbuilding design software come from piping production data or spool drawings. Estimations are that a big cruise liner, of about 350m, has about 10,000 spools. With current practices, these drawings are automatically generated and annotated. However, about 5% (with effective use of CAD and settings matching production needs) require manual work.
The process itself is quite laborious and time-consuming. However, the main culprit is the use of these drawings in production. Every drawing must be manually examined and used as an instruction to manufacture a piece of pipe and often the data provided on the drawing is not sufficient or outdated due to changes in design by the time it reaches the workshop. The possibility to generate and visualize production data at any time would remove the disconnect between design and manufacturing.
As a practical example of such developments, some CADMATIC customers already use provide an online connection to design data in the production workshop and display the data in 3D viewers with annotated models. Alternatively, they use AR with HoloLens or VR interfaces directly with the 3D model.
The foundational technologies for drawingless production are set and the direction is well-defined. The question remains whether the window of tension is enough for the innovations to progress, spread and become part of the regime.
Read also: Engineers’ reluctance to change – from drawings to a data-centric mindset
References
CABOS C., ROSTOCK (2018), Digital Model or Digital Twin? 17th Conference on Computer Applications and Information Technology in the Maritime Industries (COMPIT), Cardiff, 2018.
HAFVER, S. ELDEVIK, F.B. PEDERSEN (2018) probabilistic Digital Twins. Position paper, DNV GL
GEELS, F., 2010. Ontologies, socio-technical transitions (to sustainability), and the multi-level perspective. Research Policy 39, pp. 495-510.
KONDRATIEFF N. D., STOLPER W. F., The Long Waves in Economic Life Source: The Review of Economics and Statistics, Vol. 17, No. 6 (Nov., 1935), pp. 105-115 Published by: The MIT Press
SCHOT, J., KANGER, L., 2018. Deep transitions: Emergence, acceleration, stabilization and directionality. Research Policy.